Worldwide Governance Indicators
They measure the quality of governance in over 200 countries, based on close to 40 data sources produced by over 30 organizations worldwide and are updated annually since 2002.Some of these instruments capture the views of firms, individuals, and public officials in the countries being assessed.Criticisms include:[5][6][7] Despite the above noted limitations and concerns recent econometric research looking at how reliable some of these indicators are, vis-a-vis data collected from natural experiments and other observational surveys, have actually concluded that the Good Governance Indicators do in fact seem to be measuring, albeit imperfectly, levels of corruption and government effectiveness.[15][17][16] A number of bilateral foreign assistance agencies, such as the US Government's Millennium Challenge Corporation condition aid on a country's performance on these indicators.[18][14] These uses are often justified by reference to the connection between these indicators and development outcomes such as growth and poverty reduction as well as technical features of this dataset such as the broad country coverage and consistent, annual updates.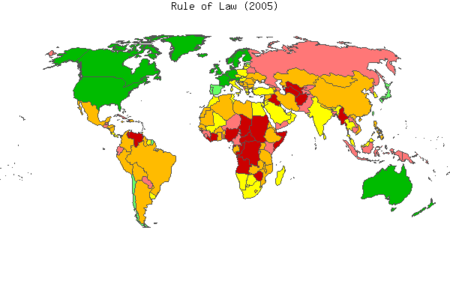
|
2005 map of Worldwide Governance Indicators, which attempts to measure the extent to which agents have confidence in and abide by the rules of society
Legend:
90–100th percentile*
75–90th percentile
50–75th percentile
25–50th percentile
10–25th percentile
0–10th percentile
* Percentile rank indicates the percentage of countries worldwide that rate below the selected country. |
PercentileWorld BankgovernanceGovernmentRule of LawCorruptioncountriesactivistsreformersadvocacycivil societygood governancedevelopmentsurveysassessmentsWorld Bank Governance SurveysWorld Bank InstituteCorruption Perceptions IndexMoody'sStandard & Poor'sMillennium Challenge CorporationIbrahim Index of African GovernanceWorld Justice ProjectCiteSeerXJournal of Development Studies