Two-photon excitation microscopy
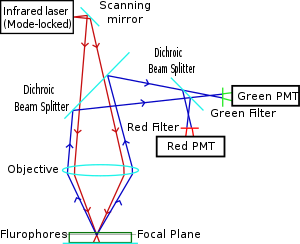
Two-photon excitation can be a superior alternative to confocal microscopy due to its deeper tissue penetration, efficient light detection, and reduced photobleaching.These techniques use focused laser beams scanned in a raster pattern to generate images, and both have an optical sectioning effect.The longer wavelength, lower energy (typically infrared) excitation lasers of multiphoton microscopes are well-suited to use in imaging live cells as they cause less damage than the short-wavelength lasers typically used for single-photon excitation, so living tissues may be observed for longer periods with fewer toxic effects.Effectively, excitation is restricted to the tiny focal volume (~1 femtoliter), resulting in a high degree of rejection of out-of-focus objects.Two-photon microscopy was pioneered and patented by Winfried Denk and James Strickler in the lab of Watt W. Webb at Cornell University in 1990.The Ti-sapphire laser normally used has a pulse width of approximately 100 femtoseconds (fs) and a repetition rate of about 80 MHz, allowing the high photon density and flux required for two-photon absorption, and is tunable across a wide range of wavelengths.For very thin objects such as isolated cells, single-photon (confocal) microscopes can produce images with higher optical resolution due to their shorter excitation wavelengths.In scattering tissue, on the other hand, the superior optical sectioning and light detection capabilities of the two-photon microscope result in better performance.[26] Currently, two-photon microscopy is widely used to image the live firing of neurons in model organisms including fruit flies (Drosophila melanogaster), rats, songbirds, primates, ferrets, mice (Mus musculus), zebrafish.[citation needed] Several green, red and NIR emitting dyes (probes and reactive labels) with extremely high 2-photon absorption cross-sections have been reported.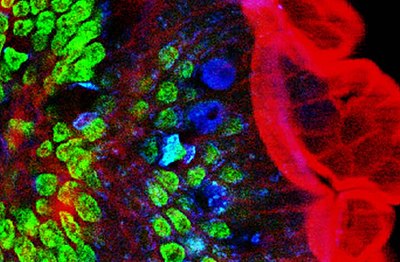


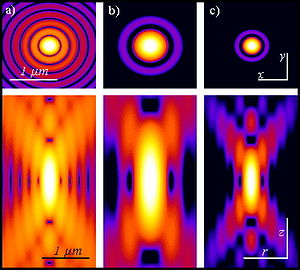
second-harmonic imaging microscopyintestinecell nucleigoblet cellsTi-sapphire laserfluorescenceliving tissuefluorescence microscopytwo-photon excitationnon-linearityconfocal microscopynear-infraredfluorescent dyespenetration depthphotobleachingrhizomelily of the valleynumerical apertureoil immersion objectivetwo-photon absorptionMaria Goeppert MayerWolfgang KaiserIsaac Abellacaesiumlaser scanning confocal microscopyRaman microscopyoptical sectioningpoint spread functionfluorophorepulsed laserTi-sapphire laserssingle-photonphotomultiplierpatentedWinfried DenkWatt W. WebbCornell Universitylight-scatteringoptical resolutiontwo-photon-based lithographysecond-harmonic generationporphyrintransition dipole momentsskin cancerbreast cancerSARS-CoV-2calcium imagingphotopharmacologyisomerizationDrosophila melanogastersongbirdsprimatesferretsMus musculuszebrafishThree-photon microscopyfluorescent proteinssquaraine dyesrotaxane3D optical data storageNonlinear opticsTwo-photon photoelectron spectroscopyWide-field multiphoton microscopyBibcodeOptical microscopyMicroscopeBright-field microscopyKöhler illuminationDark-field microscopyPhase contrastQuantitative phase-contrast microscopyDifferential interference contrast (DIC)Dispersion stainingSecond harmonic imaging (SHIM)4Pi microscopeSarfusInterference reflection microscopy (IRM/RICM)Three-photonTotal internal reflection fluorescence microscopy (TIRF)Lightsheet microscopy (LSFM/SPIM)Lattice light-sheet microscopyDiffraction limitStimulated emission depletion (STED)Photo-activated localization microscopy (PALM/STORM)Near-field (NSOM/SNOM)LasersList of laser articlesList of laser typesList of laser applicationsLaser acronymsChemical laserDye laserBubbleLiquid-crystalGas laserCarbon dioxideExcimerHelium–neonNitrogenFree-electron laserLaser diodeSolid-state laserTi-sapphireX-ray laserLaser physicsActive laser mediumAmplified spontaneous emissionContinuous waveLaser ablationLaser linewidthLasing thresholdPopulation inversionUltrashort pulseBeam expanderBeam homogenizerChirped pulse amplificationGain-switchingGaussian beamInjection seederLaser beam profilerM squaredMode lockingMultiple-prism grating laser oscillatorOptical amplifierOptical cavityOptical isolator