Confounding
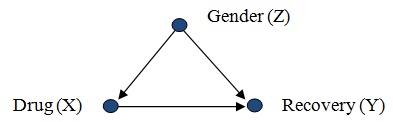
In the case of a single confounder Z, this leads to the "adjustment formula": which gives an unbiased estimate for the causal effect of X on Y.The same adjustment formula works when there are multiple confounders except, in this case, the choice of a set Z of variables that would guarantee unbiased estimates must be done with caution.The criterion for a proper choice of variables is called the Back-Door[5][6] and requires that the chosen set Z "blocks" (or intercepts) every path between X and Y that contains an arrow into X.Such sets are called "Back-Door admissible" and may include variables which are not common causes of X and Y, but merely proxies thereof.), the Back-Door adjustment formula is valid: In this way the physician can predict the likely effect of administering the drug from observational studies in which the conditional probabilities appearing on the right-hand side of the equation can be estimated by regression.In general, confounding can be controlled by adjustment if and only if there is a set of observed covariates that satisfies the Back-Door condition.[9] According to Morabia (2011),[10] the word confounding derives from the Medieval Latin verb "confundere", which meant "mixing", and was probably chosen to represent the confusion (from Latin: con=with + fusus=mix or fuse together) between the cause one wishes to assess and other causes that may affect the outcome and thus confuse, or stand in the way of the desired assessment.Greenland, Robins and Pearl[11] note an early use of the term "confounding" in causal inference by John Stuart Mill in 1843.This popularized the notion of confounding in statistics, although Fisher was concerned with the control of heterogeneity in experimental units, not with causal inference.According to Vandenbroucke (2004)[13] it was Kish[14] who used the word "confounding" in the sense of "incomparability" of two or more groups (e.g., exposed and unexposed) in an observational study.Formal conditions defining what makes certain groups "comparable" and others "incomparable" were later developed in epidemiology by Greenland and Robins (1986)[15] using the counterfactual language of Neyman (1935)[16] and Rubin (1974).[11][5] Graphical criteria were shown to be formally equivalent to the counterfactual definition[18] but more transparent to researchers relying on process models.For prospective studies, it is difficult to recruit and screen for volunteers with the same background (age, diet, education, geography, etc.[23] When there is not a large sample population of non-smokers or non-drinkers in a particular occupation, the risk assessment may be biased towards finding a negative effect on health.[24] A reduction in the potential for the occurrence and effect of confounding factors can be obtained by increasing the types and numbers of comparisons performed in an analysis.Peer review is a process that can assist in reducing instances of confounding, either before study implementation or after analysis has occurred.Peer review relies on collective expertise within a discipline to identify potential weaknesses in study design and analysis, including ways in which results may depend on confounding.Lastly, the relationship between the environmental variables that possibly confound the analysis and the measured parameters can be studied.The information pertaining to environmental variables can then be used in site-specific models to identify residual variance that may be due to real effects.The major threats to internal validity are history, maturation, testing, instrumentation, statistical regression, selection, experimental mortality, and selection-history interactions.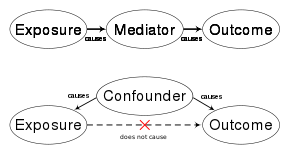
Confounding FactorConfusioncausal inferencedependent variable and independent variablespurious associationcausalcorrelation does not imply causationnotationsinternal validityindependent variabledependent variableextraneous variablesconditional probabilitycontrolled experimentrandomizedBayesian networkControlling for a variablecolliderBerkson's paradoxbad controlsMedieval LatinFisherblockingpartitioningfactorial experimentepidemiologyNeymanrisk assessmentshealthpesticideexperimentsobservational studiesrandom assignmentexperimentalquasi-experimentDown Syndromemultiple comparisonsPeer reviewreplicationCase-control studiesCohort studiesstatistically significantDouble blindingplacebo effectRandomized controlled trialStratificationrisk ratioscovariatesmultivariable analysisregression analysisantidepressantrandomized studysufficiently largesham treatmentsexternal validitystatistical regressioncontrol groupObservational interpretation fallacyAnecdotal evidenceEpidemiological methodSimpson's paradoxOmitted-variable biasHoughton-MifflinSci RepBibcodeCiteSeerXAmerican Journal of EpidemiologyLippincott Williams & WilkinsNew England Journal of Medicinesocial researchLawrence Erlbaum AssociatesCambridge University PressStatisticsOutlineDescriptive statisticsContinuous dataCenterArithmeticArithmetic-GeometricContraharmonicGeneralized/powerGeometricHarmonicHeronianLehmerMedianDispersionAverage absolute deviationCoefficient of variationInterquartile rangePercentileStandard deviationCentral limit theoremMomentsKurtosisL-momentsSkewnessCount dataIndex of dispersionContingency tableFrequency distributionGrouped dataDependencePartial correlationPearson product-moment correlationRank correlationKendall's τSpearman's ρScatter plotGraphicsBar chartBiplotBox plotControl chartCorrelogramFan chartForest plotHistogramPie chartQ–Q plotRadar chartRun chartStem-and-leaf displayViolin plotData collectionStudy design